QR Code Analytics
Track exactly how your QR codes perform with comprehensive analytics. Know your audience, measure success, and optimize campaigns.
What You Can Track
Get detailed insights into how people interact with your QR codes.
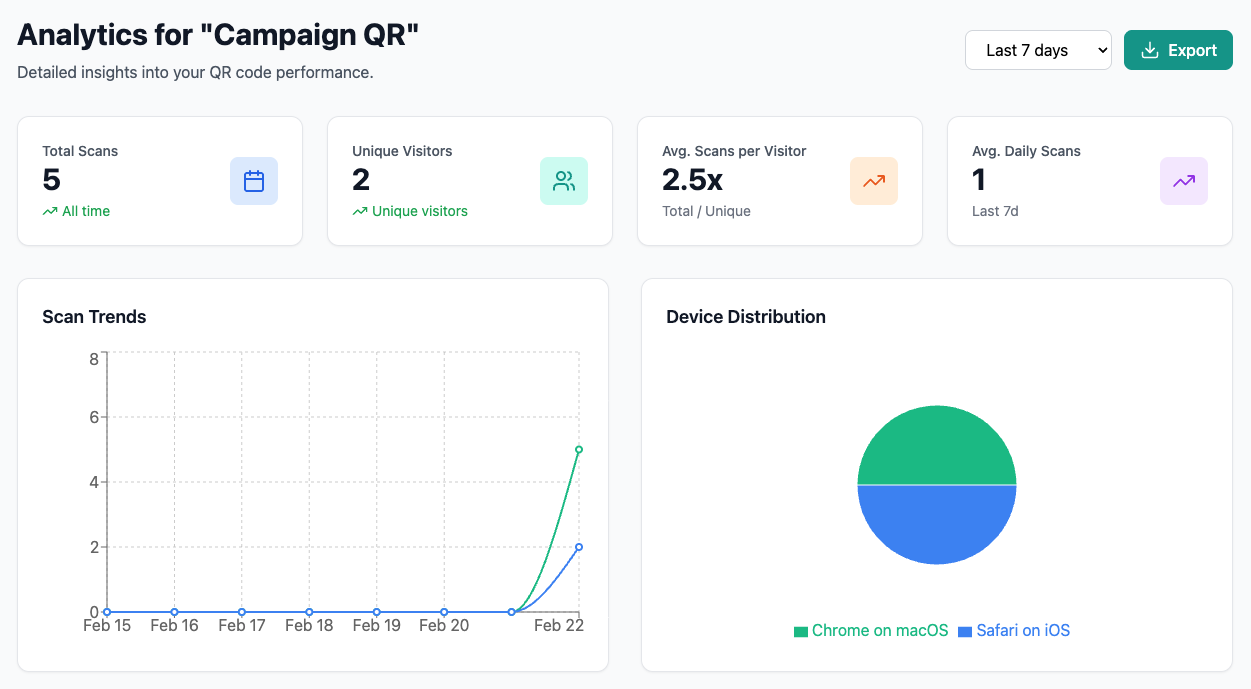
Total Scans & Unique Visitors
See how many times your QR code was scanned and how many individual people scanned it.
Device Types
Know if your audience is on iOS, Android, or scanning from web browsers.
Interactive Location Map
Drill down from country to state/province to city with an interactive map showing exactly where your scans originate.
Daily Trends
Track scan patterns over time with beautiful charts and visualizations.
Time Range Filters
Filter by last 7 days, 30 days, or 90 days to analyze different periods.
CSV Export
Download your data for analysis in Excel, Google Sheets, or other tools.
VPN Detection
Identify scans that come from VPN or proxy connections for more accurate location data.
Analytics Dashboard
Beautiful charts and clear metrics at your fingertips.
Drill-Down Location Tracking
Go beyond country-level data. Click into any country to see states and provinces, then drill deeper to individual cities.
World View
Start with a global view showing all countries where your QR code has been scanned.
State & Province
Click into US or Canada to see individual states and provinces with scan data.
City Breakdown
See exactly which cities your scans come from, with daily breakdowns for each location.
Data-Driven Decisions
Stop guessing whether your QR codes are working. With QRFlow analytics, you get real insights to optimize your campaigns and understand your audience.
- See which campaigns perform best
- Understand your audience demographics
- Export data for deeper analysis
Time Range Filters
Analyze different periods to understand patterns and trends.
Export Your Data
Download your analytics as CSV for analysis in Excel, Google Sheets, or other tools.
Pricing
Analytics are included with QRFlow Premium.
Premium
Billed annually at $48/year
- Complete analytics dashboard
- Device & location tracking
- CSV export
- QR codes have no expiration